Instructions For Using the Site


Technically and operationally there will be some small changes.
First, the electrolevels measure rotation, not vertical movement. Those of us that are used to cracks opening and closing 3mm, or buildings going up or down by 10mm will have to learn how to interpret different data. EL’s measure rotation in degrees. We know that movement – rotation – greater than 0.1 degrees is probably structurally ‘significant’. We understand that movement below this may be due to temperature change, variations in signal strength and/or vibration.
We also understand that it will be the difference between the readings from two sensors (one close to the tree and another remote, acting as a datum) that is significant, and not the absolute values.
Moisture change is easier. The sensors measure moisture change directly as percentage points and we should see soil drying or wetting up seasonally. When we view the results from both the moisture sensors and the electrolevels, we should see movement accompanying this change near to the tree, and relative stability elsewhere.
Moisture change units are as we understand them now (expressed as volumetric rather than gravimetric), as are the temperature changes, which we record in degrees Centigrade.
It is envisaged that we will use electrolevels initially to gather evidence when there is a Local Authority tree on London Clay that is thought to be the cause of damage. Other uses might be large retaining walls where liability is engaged, heave and complex cases where the cause of movement isn’t clear but where daily readings will provide advice and assurance.


Creating a New Claim
After logging in you will be presented with the screen shown below. Here you can search for an existing claim by entering the claims reference or create a new claim.
To create a new claim either enter a reference code into the box labelled "Create New Claim" or click on the top link "New Claim".
The New Claims Page
Once on the New Claims page enter in the claim details. Reference, Insured's name, address and postcode plus contact telephone number.
Once completed click on "Create", this will now take you to the Claim Details page.
Claims Detail Page
Once on the Claim Deatils page you will be presented with a screen similar to below.
To instruct the monitoring company via email click the "INSTRUCTION TO SIPPS" button. The installation contractor then notes where each of the sensors is located and on return to the office they complete the various screens recording the location of the boxes and notify BOX that the equipment is transmitting. Using the system they then issue an email confirmation to the instructor.
The instructor takes over the handling of the claim by clicking "UPLOAD LIVE DATA" whenever they visit the application.
It may take BOX a few days to deliver live data following installation but if nothing is received with in a week, notify the service provider who will make enquiries.
Claims Detail Continued
Once data has been uploaded the screen should then contain information similar to that shown below.
The data can be changed at anytime - click on "Update Claim Details" after making changes or they will be lost.
Correlation of 0 shows no correlation at all. Sensors 2 and 3 have a probability correlation of 55 and 59 respectively, and the difference between them and sensor 1 provides evidence of clay shrinkage.
Claim Details and Variances
Looking at the Sensor Data for this claim we can see that Sensor 1 was 0.025. We regard this as being significant in the sense that anything less than 0.02 could be attributable to temperature changes and sensitivities surrounding signal strength etc. A difference greater than 0.02 is considered to be significant in terms of "structural movement sufficient to damage".
Movement less than 0.02 could be the result of changes in temperature, signal loss or vibration.
Registering the Sensors
This screen is reached by clicking on the "Details" buttons that are found on the Claims Detail page and allows the user to enter the sensor location and the orientation - clockwise or anti-clockwise.
After making any alterations click the "Update Sensor" button then finally select the "Back" button to return to the Claim Details page.
Creating A Report
At the bottom of the claim details page you will see a drop down list and two free form text fields and are for when the user has arrived at a diagnosis and wishes to enter findings and recommendations.
Choose from the drop down list what the found pattern of movement is indicative of and then complete the two free text boxes. The text you insert here will populate the final report. The top box is where you outline your findings, discussing and interpreting the data.
For example: "Sensor 1 - nearest the tree - has moved twice as much as Sensor 3, away from the tree".
The lower box is obviously where you enter your recommendations.
For Example: "For long term stability, the tree should be removed" or "the nearby drains should be investigated and repaired", etc.
To view a draft version of your report simply click on the "CREATE HTML REPORT" button. This can then be printed off for checking. Once you are satisfied with the report you can click on the "CREATE PDF REPORT" (if you are not completely happy with the preview HTML you can make changes to it on the Claims Report screen but ensure you click the "Update" button and then create the PDF report once you are entirely satisfied with the content.
Clicking on the "CREATE PDF REPORT" button will store a copy of your report on the Subsidence Software System. If the wording in the final PDF does not match that on the screen then it is because you haven't pressed the update button.
On Completion Of Monitoring
On completion of the monitoring, instruct the service provider to de-commission the equipment by selecting the E-mail instruction "REMOVE EQUPMENT" button at the top of the Claims Detail page. Line rental charges accrue while the equipment is on site transmitting data, so ensure the instruction is issued as soon as the term is complete.
Clockwise & Anti-Clockwise Movement - Significance
To understand the direction of movement – i.e., is the building moving downwards in the summer, and recovering in the winter – it is useful to have some concept of the sensor orientation, location and time the readings were taken.
The designation reflects ‘what we are expecting to happen’ and the probability value tells us whether this is a good match or not, but it isn’t essential to detect movement.
Here the "active" sensor is coloured red and is positioned below the crack, fixed to the section of masonry that is moving. If the sensor was situated above the crack (blue) it would not detect movement.
Clockwise & Anti-Clockwise Movement - Significance (continued)
In this case, the engineer is monitoring movement due to root induced desiccation and he will be anticipating clockwise movement, with the sensor rotating in the clockwise direction as the wall subsides in the summer, and anti-clockwise as it recovers. The rotation always refers to the downward movement cycle.
Had the sensor been installed on the other side of the building, the sensor would be labelled as "anti-clockwise" (see below).
Clockwise & Anti-Clockwise Movement - Significance (continued)
In cases where the sensor has to be "face fixed" to a wall - a front bay window for example - care has to be taken because the assembly housing the sensor is fitted to an angle bracket and the direction of the sensor should be accounted for.
Below is an example of a bracket being fixed to the front wall of a bay window, and the damage is thought to be related to a tree growing nearby.
The designation of "clockwise" or "anti-clockwise" depends on which face of the angle bracket the sensor is fitted.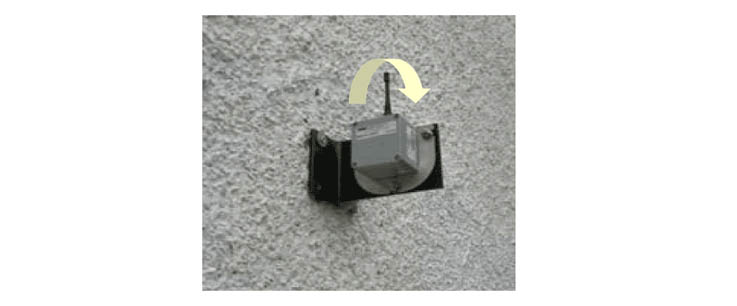
Examples
Below we see a typical plot of root induced clay shrinkage. The building subsides from May onwards, and peaks in September before recovering. Electrolevels are excellent in helping to detect when the movement has peaked. We see the diurnal pattern of movement associated with temperature change. All of the data commences at zero to allow comparisons to be made. ‘Dropped ‘signals’ are catered for by removal of subsequent zero values. Spikes are smoothed to allow the user to remove system anomalies.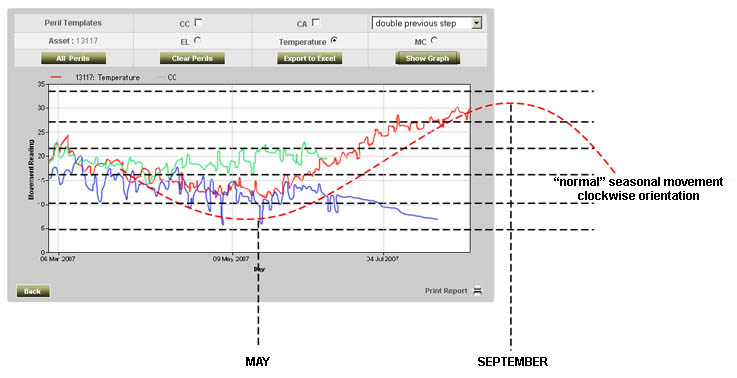
Quick User Guide - Viewing Existing Claim
1. Log on to System.
2. Enter claim reference or search to locate.
3. Open ‘Claim Details’ screen and check data. Ensure all of the address fields are completed.
4. Check variance and, if available, probability.
5. Open ‘Readings’ screen.
6. Plot sensors with the ‘CC’ or ‘CA’ templates visible (to make visible, check adjoining box) and consider with temperature. Smooth data if required.
7. Decide if there is evidence of movement. If there is, is the movement seasonal? Consider possible causes. Is the building stable? Do we need more data?
8. Once a decision has been made, instruct de-commissioning using the E-mail function and produce reports first in HTML to view on screen, and once satisfied, produce .PDF file.
9. If further readings are needed, print off .pdf and update insurer, homeowner as required.
Homeowner Guidelines
Your home is being monitored using the most advanced sensor technology available with the objective of resolving your claim quickly and efficiently.
The sensors measure:
1. Building movement
2. Temperature
3. Moisture Content (only installed in some cases)
We are able to review the data at regular intervals from our offices using the internet, and if you would like access, follow these steps:
1. Enter the web address as follows: http://www.datareader.keyclaim.co.uk/datareader/
2. User Name – ‘insured surname’
3. Password – ‘claim ref’
4. On 'search for claim', enter your claim ref which is ‘xxxxxx’. This takes you to the ‘Claim’ Details’ page.
5. Select the 'Upload Data' button to refresh data from the server and wait a few seconds.
6. You will see the max, min and difference values, temperature etc.,.
7. To plot them graphically, select the 'Readings' tab across the top of the screen.
8. Select 'Show Graph' and you will see by default the output from the tilt sensors.
9. You can then check the 'Temperature' > 'Show Graph' to see if there is any correlation with the movement.
Movement is measured in degrees, not 'mm'. This equates to about 0.25mm. We are looking for trends rather than absolute values. Is the building moving, and if so, in what direction. If it is moving, is it within tolerable limits. 'Tolerable' isn't defined by a value - it is based on serviceability criteria. "Is it cracking when it moves", "are there distortions that could cause problems".
The "Instruct Telemetry" Template
When instructing monitoring, the technician needs to know where the sensors are to be placed and their orientation. The template offers a selection of standard house types, or blank boxes for non-standard houses.
Delete the elevations that aren’t needed, and ‘stretch’ those that are to fit the page.
Drag and drop the sensors to their required location, and mark the cracks. This is a diagrammatic sketch to locate them and doesn’t need to be too detailed.
Use the grey ‘box’ to represent extensions, and the blank squares for non-standard buildings.
Save the document on your machine, and when instructing the installer via the E-mail button on the Claim Details screen of the DataREADER, use the ‘browse to’ function to attach.